> ## Documentation Index
> Fetch the complete documentation index at: https://docs.evolvingmachines.ai/llms.txt
> Use this file to discover all available pages before exploring further.
# Trial viewer
> Read one trial's trace event by event, its tool calls, its spend, and download its artifacts.
Click a trial on a job's TRIALS tab, or a row on the Traces page, to open it.
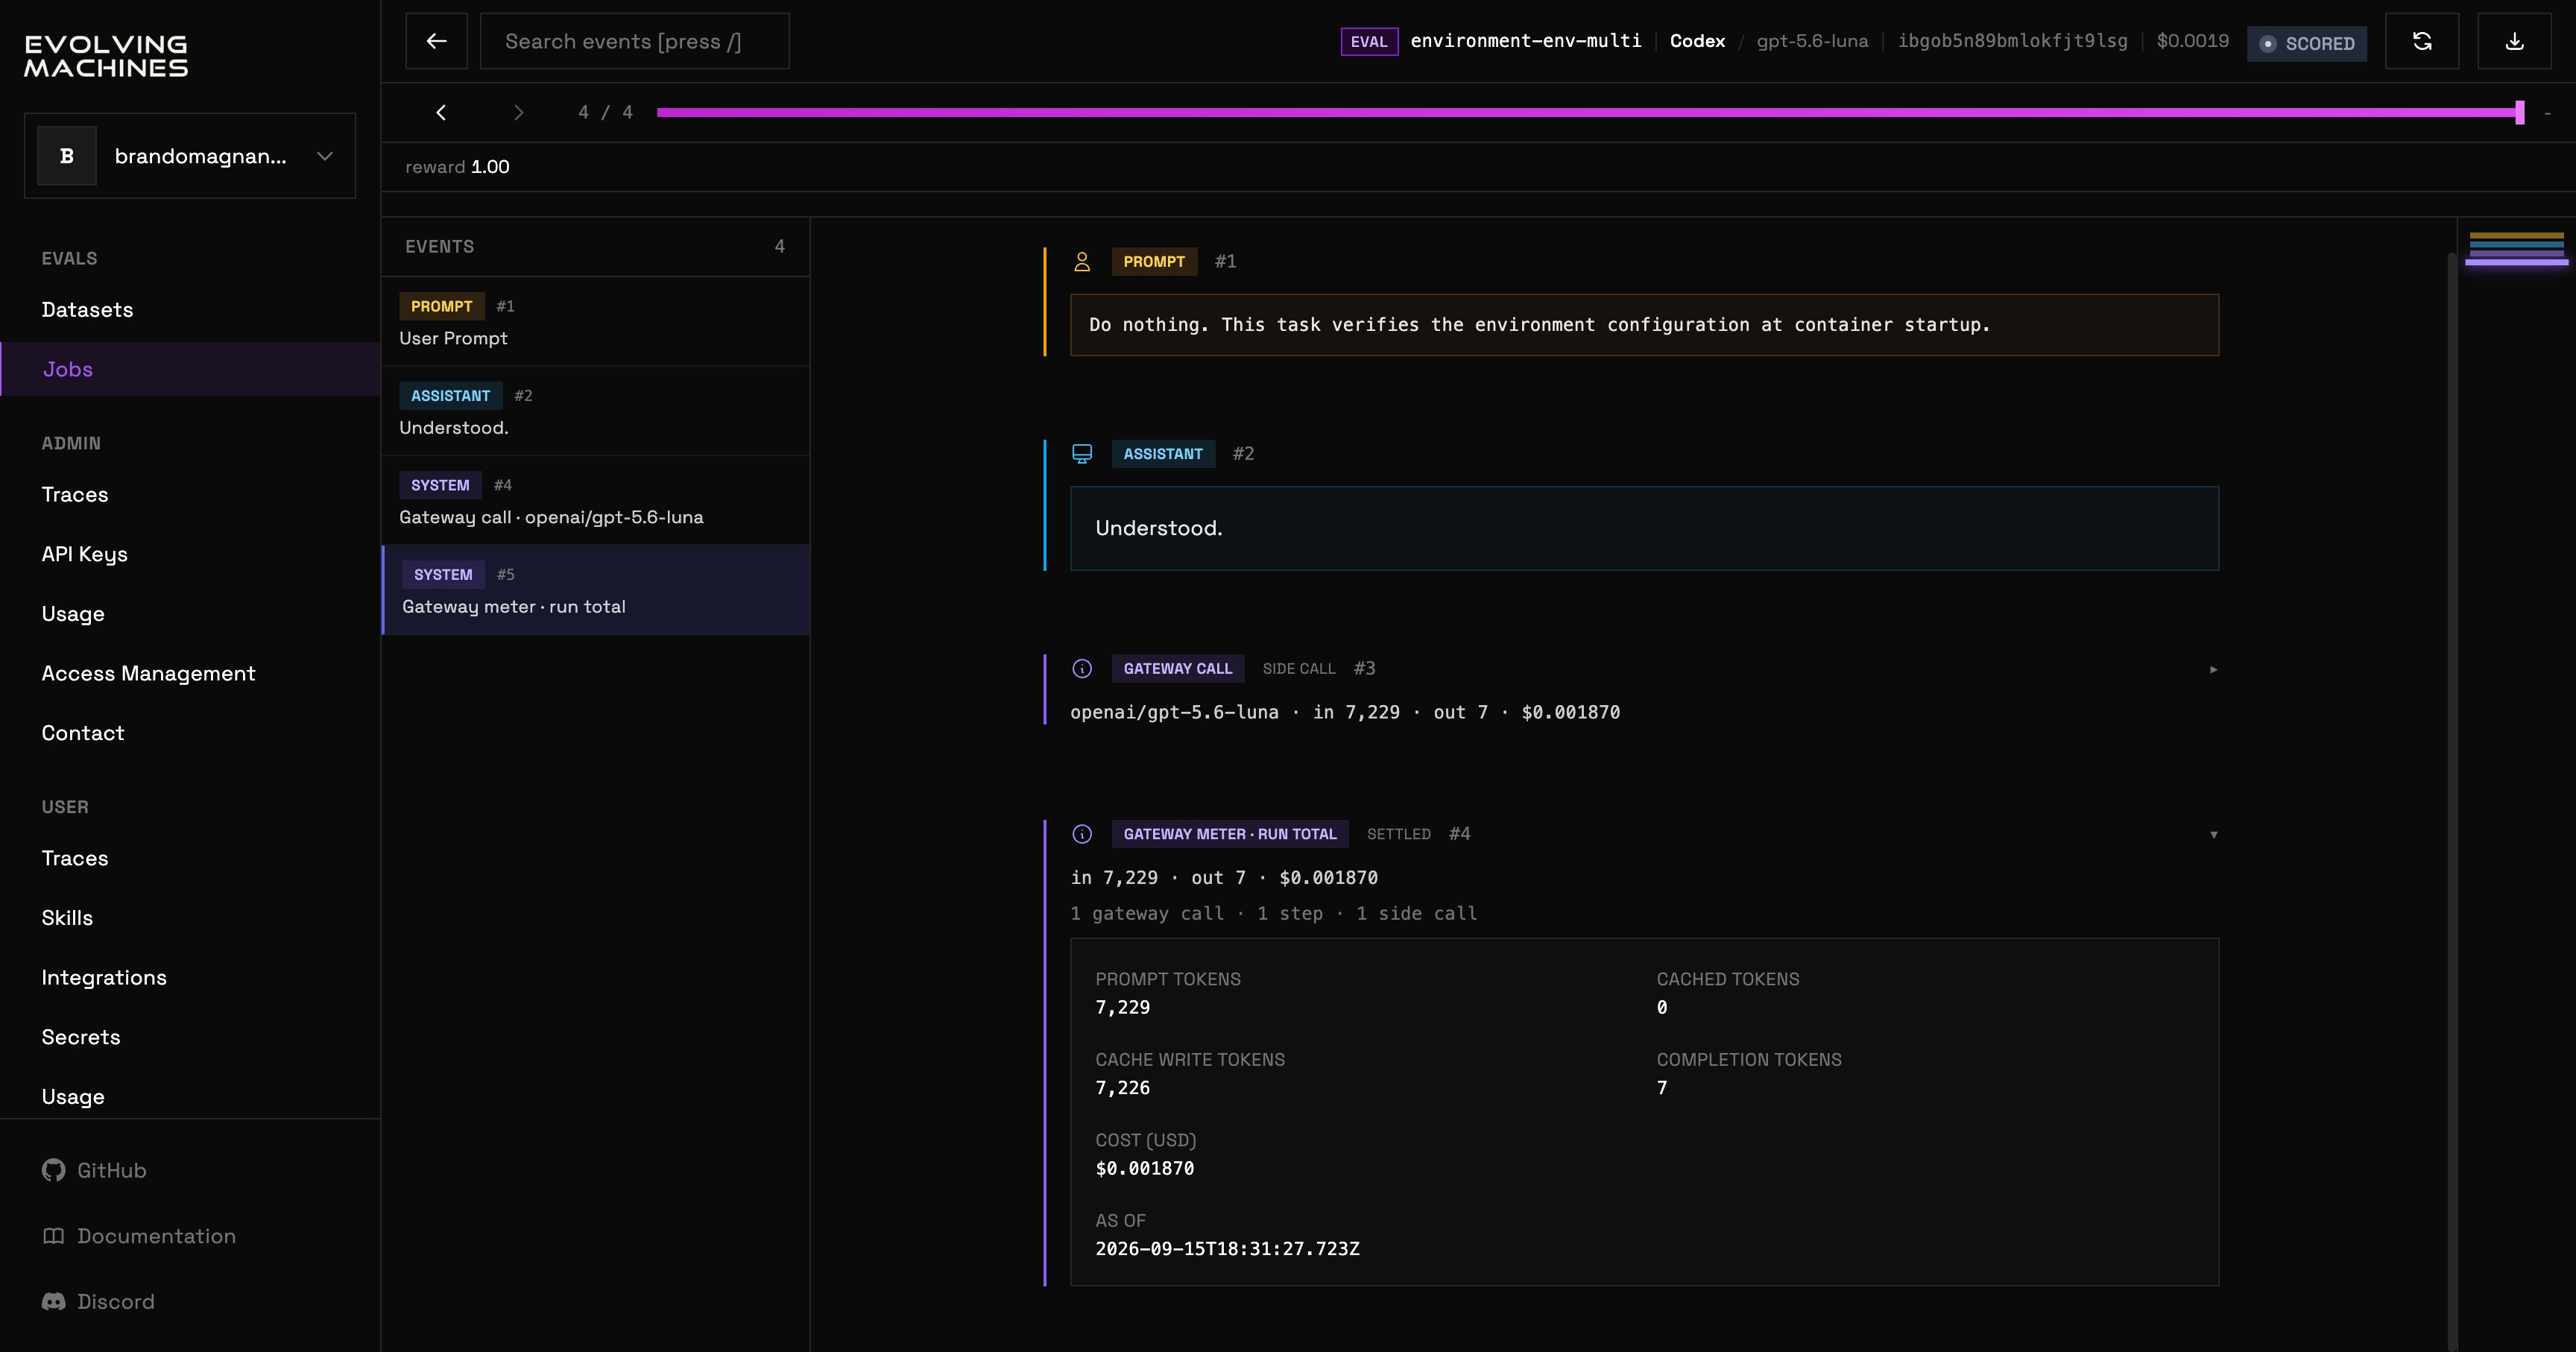 The header names the run: its kind (EVAL for a trial, AGENT for a managed-agent session, REGRADE, ANALYZE, or CHECK), its task, its agent and model, its sandbox id, what it spent, and its status.
BACK returns to where you came from. RETRY runs a settled trial again as a new one-trial job. STOP ends a run that is still going.
DOWNLOAD on a trial offers the parsed trace, the ATIF trajectory, the raw stdout, the raw stderr, the agent home folder, the verifier log, or everything at once; on an analysis or a check it offers the verdict document, the raw stdout, the raw stderr, the agent home folder, or everything.
Under the header, the reward and the event navigation: previous, next, and a progress bar you can drag. Type `/` to search the events.
The EVENTS list runs down the left: the prompt, each assistant message and thought, each tool call and its result, and the gateway's own records: one per model call with its tokens and cost, and a run total at the end. Click an event to read it in full on the right. A running trial keeps appending events while you watch.
The header names the run: its kind (EVAL for a trial, AGENT for a managed-agent session, REGRADE, ANALYZE, or CHECK), its task, its agent and model, its sandbox id, what it spent, and its status.
BACK returns to where you came from. RETRY runs a settled trial again as a new one-trial job. STOP ends a run that is still going.
DOWNLOAD on a trial offers the parsed trace, the ATIF trajectory, the raw stdout, the raw stderr, the agent home folder, the verifier log, or everything at once; on an analysis or a check it offers the verdict document, the raw stdout, the raw stderr, the agent home folder, or everything.
Under the header, the reward and the event navigation: previous, next, and a progress bar you can drag. Type `/` to search the events.
The EVENTS list runs down the left: the prompt, each assistant message and thought, each tool call and its result, and the gateway's own records: one per model call with its tokens and cost, and a run total at the end. Click an event to read it in full on the right. A running trial keeps appending events while you watch.
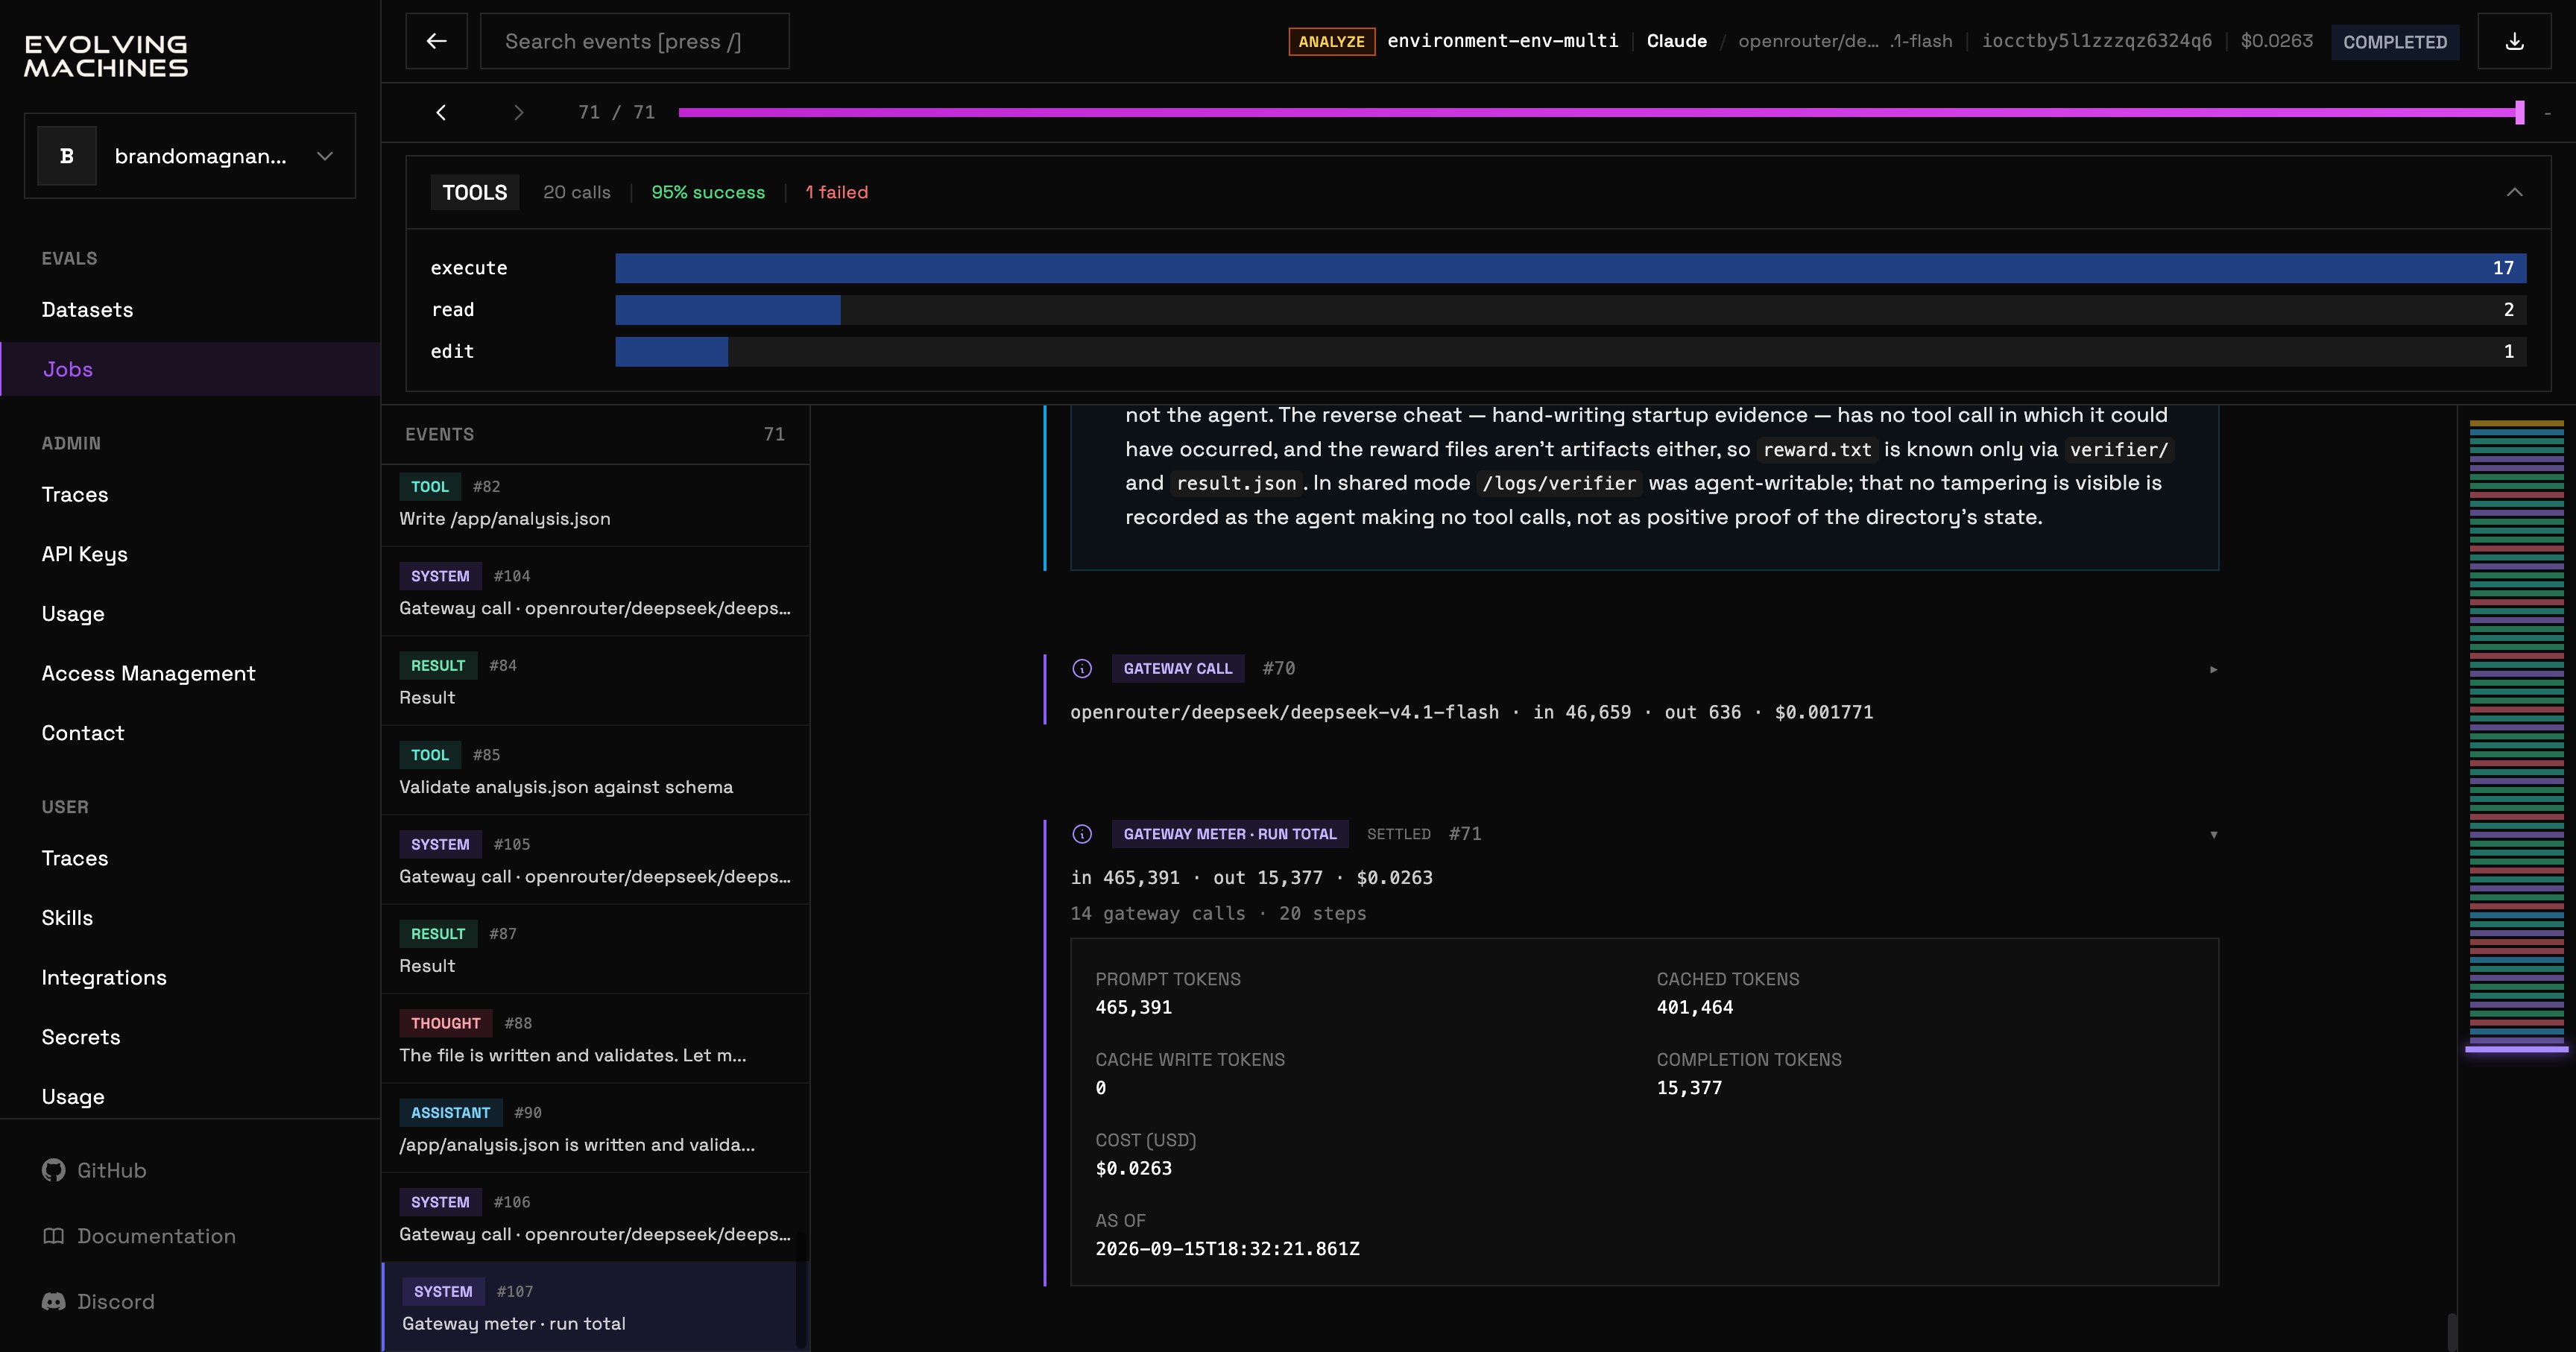 The panel above the events has two tabs. TOOLS counts the run's tool calls, its success rate and how many failed, with a bar per tool. SPEND shows what the run spent. The gateway meter at the end of the run states the prompt, cached, cache-write and completion tokens and the cost in dollars.
An analysis, a check or a regrade is read the same way. An analysis's events are the analyzer's own trace, and its verdict document is on the DOWNLOAD menu.
The panel above the events has two tabs. TOOLS counts the run's tool calls, its success rate and how many failed, with a bar per tool. SPEND shows what the run spent. The gateway meter at the end of the run states the prompt, cached, cache-write and completion tokens and the cost in dollars.
An analysis, a check or a regrade is read the same way. An analysis's events are the analyzer's own trace, and its verdict document is on the DOWNLOAD menu.